
Portfolio Suitability: In the last three years, Nike’s correlation to consumer discretionary sector is at 0.01. In simple terms, for the last three years, Nike’s stock doesn’t have any relation to the movement of consumer discretionary sector. So, even though Nike is considered to be a consumer discretionary stock, its stock isn’t behaving in line with the sector. The reason for this anomaly could lie in the fact that most consumer discretionary stocks are heavily dependent on US for their revenues while Nike isn’t. Infact, Nike’s three year correlation to the consumer staple sector is at 0.91 and at 0.89 to the utilities sector. This reinforces the theory that Nike will not be severely affected by a further slide in the US economy.

Sector Performance: Nike belongs to the consumer discretionary sector, a sector which we have been underweight since we started seeing some signs of an economic downturn in the US in June (2007) when an inverted yield curve puzzled everyone. An inverted yield curve is almost always a leading indicator of an economic slowdown since forward yields are low in one of the two circumstances; either the GDP growth is expected to decline or inflation is expected to decrease. However, with central banks worldwide having trouble keeping inflation at bay, the possibility of decline in GDP growth was more realistic. A decline in GDP wouldn’t bode well for the consumer discretionary sector and so we have been underweight on that sector for quite some time now. In the first half of 2008, we have seen a slowdown in GDP growth coupled with high inflation. However, the yield curve is now upward sloping and so GDP growth is expected to pick-up sometime next year (2009). This begs the question if it is a good time to get back into the consumer discretionary sector while it is still reeling from an effect of a downturn and selling at a discount; XLY - Consumer Discretionary SPDR - is selling close to its five year lows in the mid 20s. The yield curve is just one indicator of GDP growth and so I looked at performance of XLY during the last economic recession; 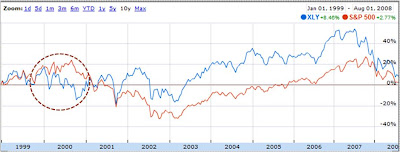 I used the last recession as a point of comparison since the macroeconomic conditions would be the closest, if not the same, for companies operating in the last 10 years. As we can see in the first chart, XLY underperformed S&P only for one year – 2000 - during the last recession. We want to check the performance of XLY in the last one year; the next chart compares XLY’s performance with S&P in the last one year and it has
 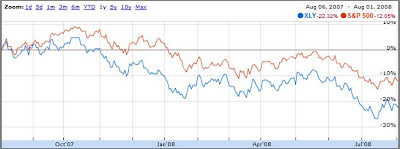 underperformed the S&P by about 10 percentage points. However, given the current credit market turmoil, I was still a little wary of this sector. Focusing on companies with extensive international exposure would mitigate the risk of a prolonged downturn in the US markets and Nike tops that list, moreover, Nike is underpriced which makes for a good value investment.
 I used the last recession as a point of comparison since the macroeconomic conditions would be the closest, if not the same, for companies operating in the last 10 years. As we can see in the first chart, XLY underperformed S&P only for one year – 2000 - during the last recession. We want to check the performance of XLY in the last one year; the next chart compares XLY’s performance with S&P in the last one year and it has
  underperformed the S&P by about 10 percentage points. However, given the current credit market turmoil, I was still a little wary of this sector. Focusing on companies with extensive international exposure would mitigate the risk of a prolonged downturn in the US markets and Nike tops that list, moreover, Nike is underpriced which makes for a good value investment.
  In the last one year, Nike has outperformed the S&P by about 15 percentage points while XLY has underperformed the S&P by 10 percentage points. Clearly, Nike is not following declines of the consumer discretionary sector in this downturn and that could be because of its extensive international exposure. In 1999-2000, Nike’s revenues from US were at 52% while 34% of Nike’s TTM revenues are from US. The recent slide in Nike’s price is attributed to flat orders from US for the rest of 2008 and so a slowdown in the US is already priced in the stock. The market ignored Nike’s excellent performance in the international segment. Nike’s revenues are well diversified and a slowdown in any one region of the world is less likely to have a significant impact on Nike’s overall performa
 nce.
nce.


